You have programmed a way to visually see how close together two micro:bits are.
Experiment to work out what the graph on the micro:bits look like when they are 2m apart (your table is approximately 1.4m diagonally).
You can edit your code so that the micro:bits do one thing when they are closer than 2m, and something different when they are more than 2m apart.
When your micro:bits are close together the signal strength is higher than when they are far apart. The signal block gives you a number between 0 and 9.
Use the blocks in the Logic menu to get something happening if the signal is less than 4, and something different happening if this is not true.
Recreate the image below using the Logic and Basic menus. Scroll down for instructions, or skip to the calibration step once your new code is working correctly!
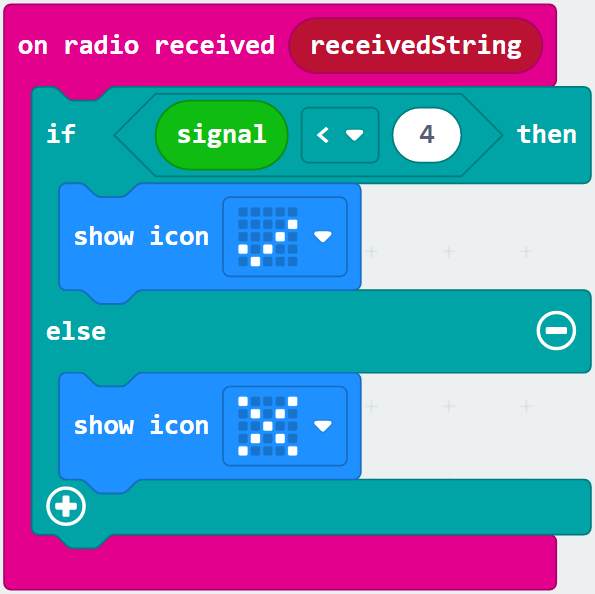
Replace your bar graph block with an if true then else block from the Logic menu.
Also from the Logic menu, drop a 0 < 0 block to replace true.
Finally, replace the first 0 with signal, and the second 0 with 4.
Put a show icon block into both of the spaces in the if then else block, and you are ready to test and calibrate your program!
We chose to use less than 4 in the previous step, but this might not be the signal strength at 2m.
You will need to experiment with your micro:bits and choose the correct number.
Make sure the updated code is on both of your micro:bits, and place them at each end of your table. If you are in our workshop, diagonally across your table is 1.4m.
What do you want to happen when the micro:bits are close together vs further apart?
Try connecting a speaker or an LED, to make the micro:bit beep or flash a warning.