Resources for the 'Data Lab' Creative Computing Club.
This page recaps what we discussed as a group.
To skip to the examples and ideas, click here.
Click here for the starter program containing all of the extensions we will use during the workshop.
Go to the MakeCode editor, and click New Project.
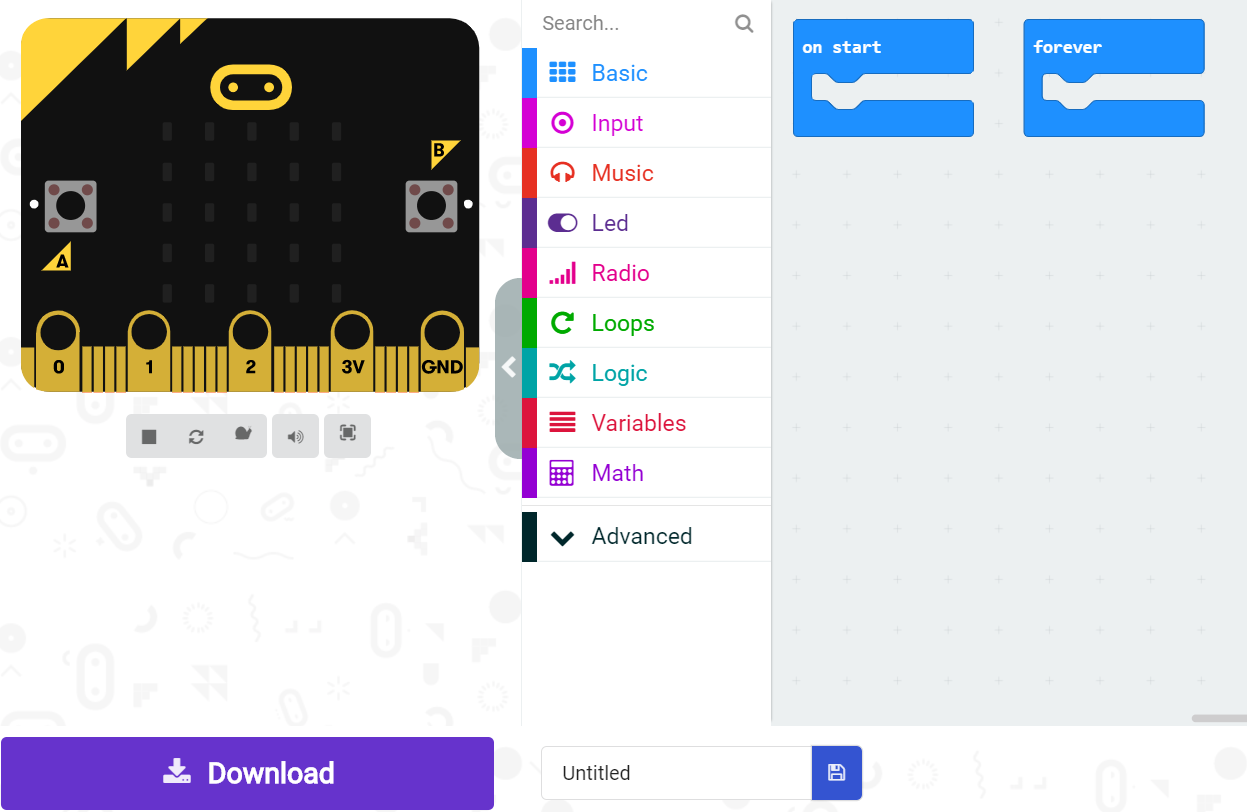
Drag and drop code blocks (click into the Basic menu), to recreate this code:
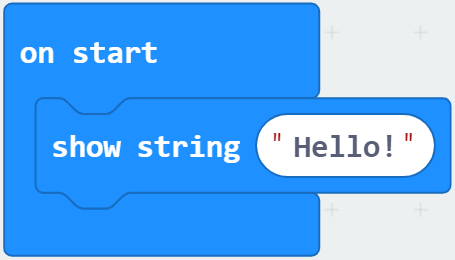
You will see it running on the emulator on the left of your screen.
Follow the instructions to pair your micro:bit, then click Download to send your code to your physical micro:bit.
These screens have four pins, which are connected to the micro:bit using and edge connector.
If you are our workshop, just push your micro:bit into the edge connector - we have connected the pins up for you!
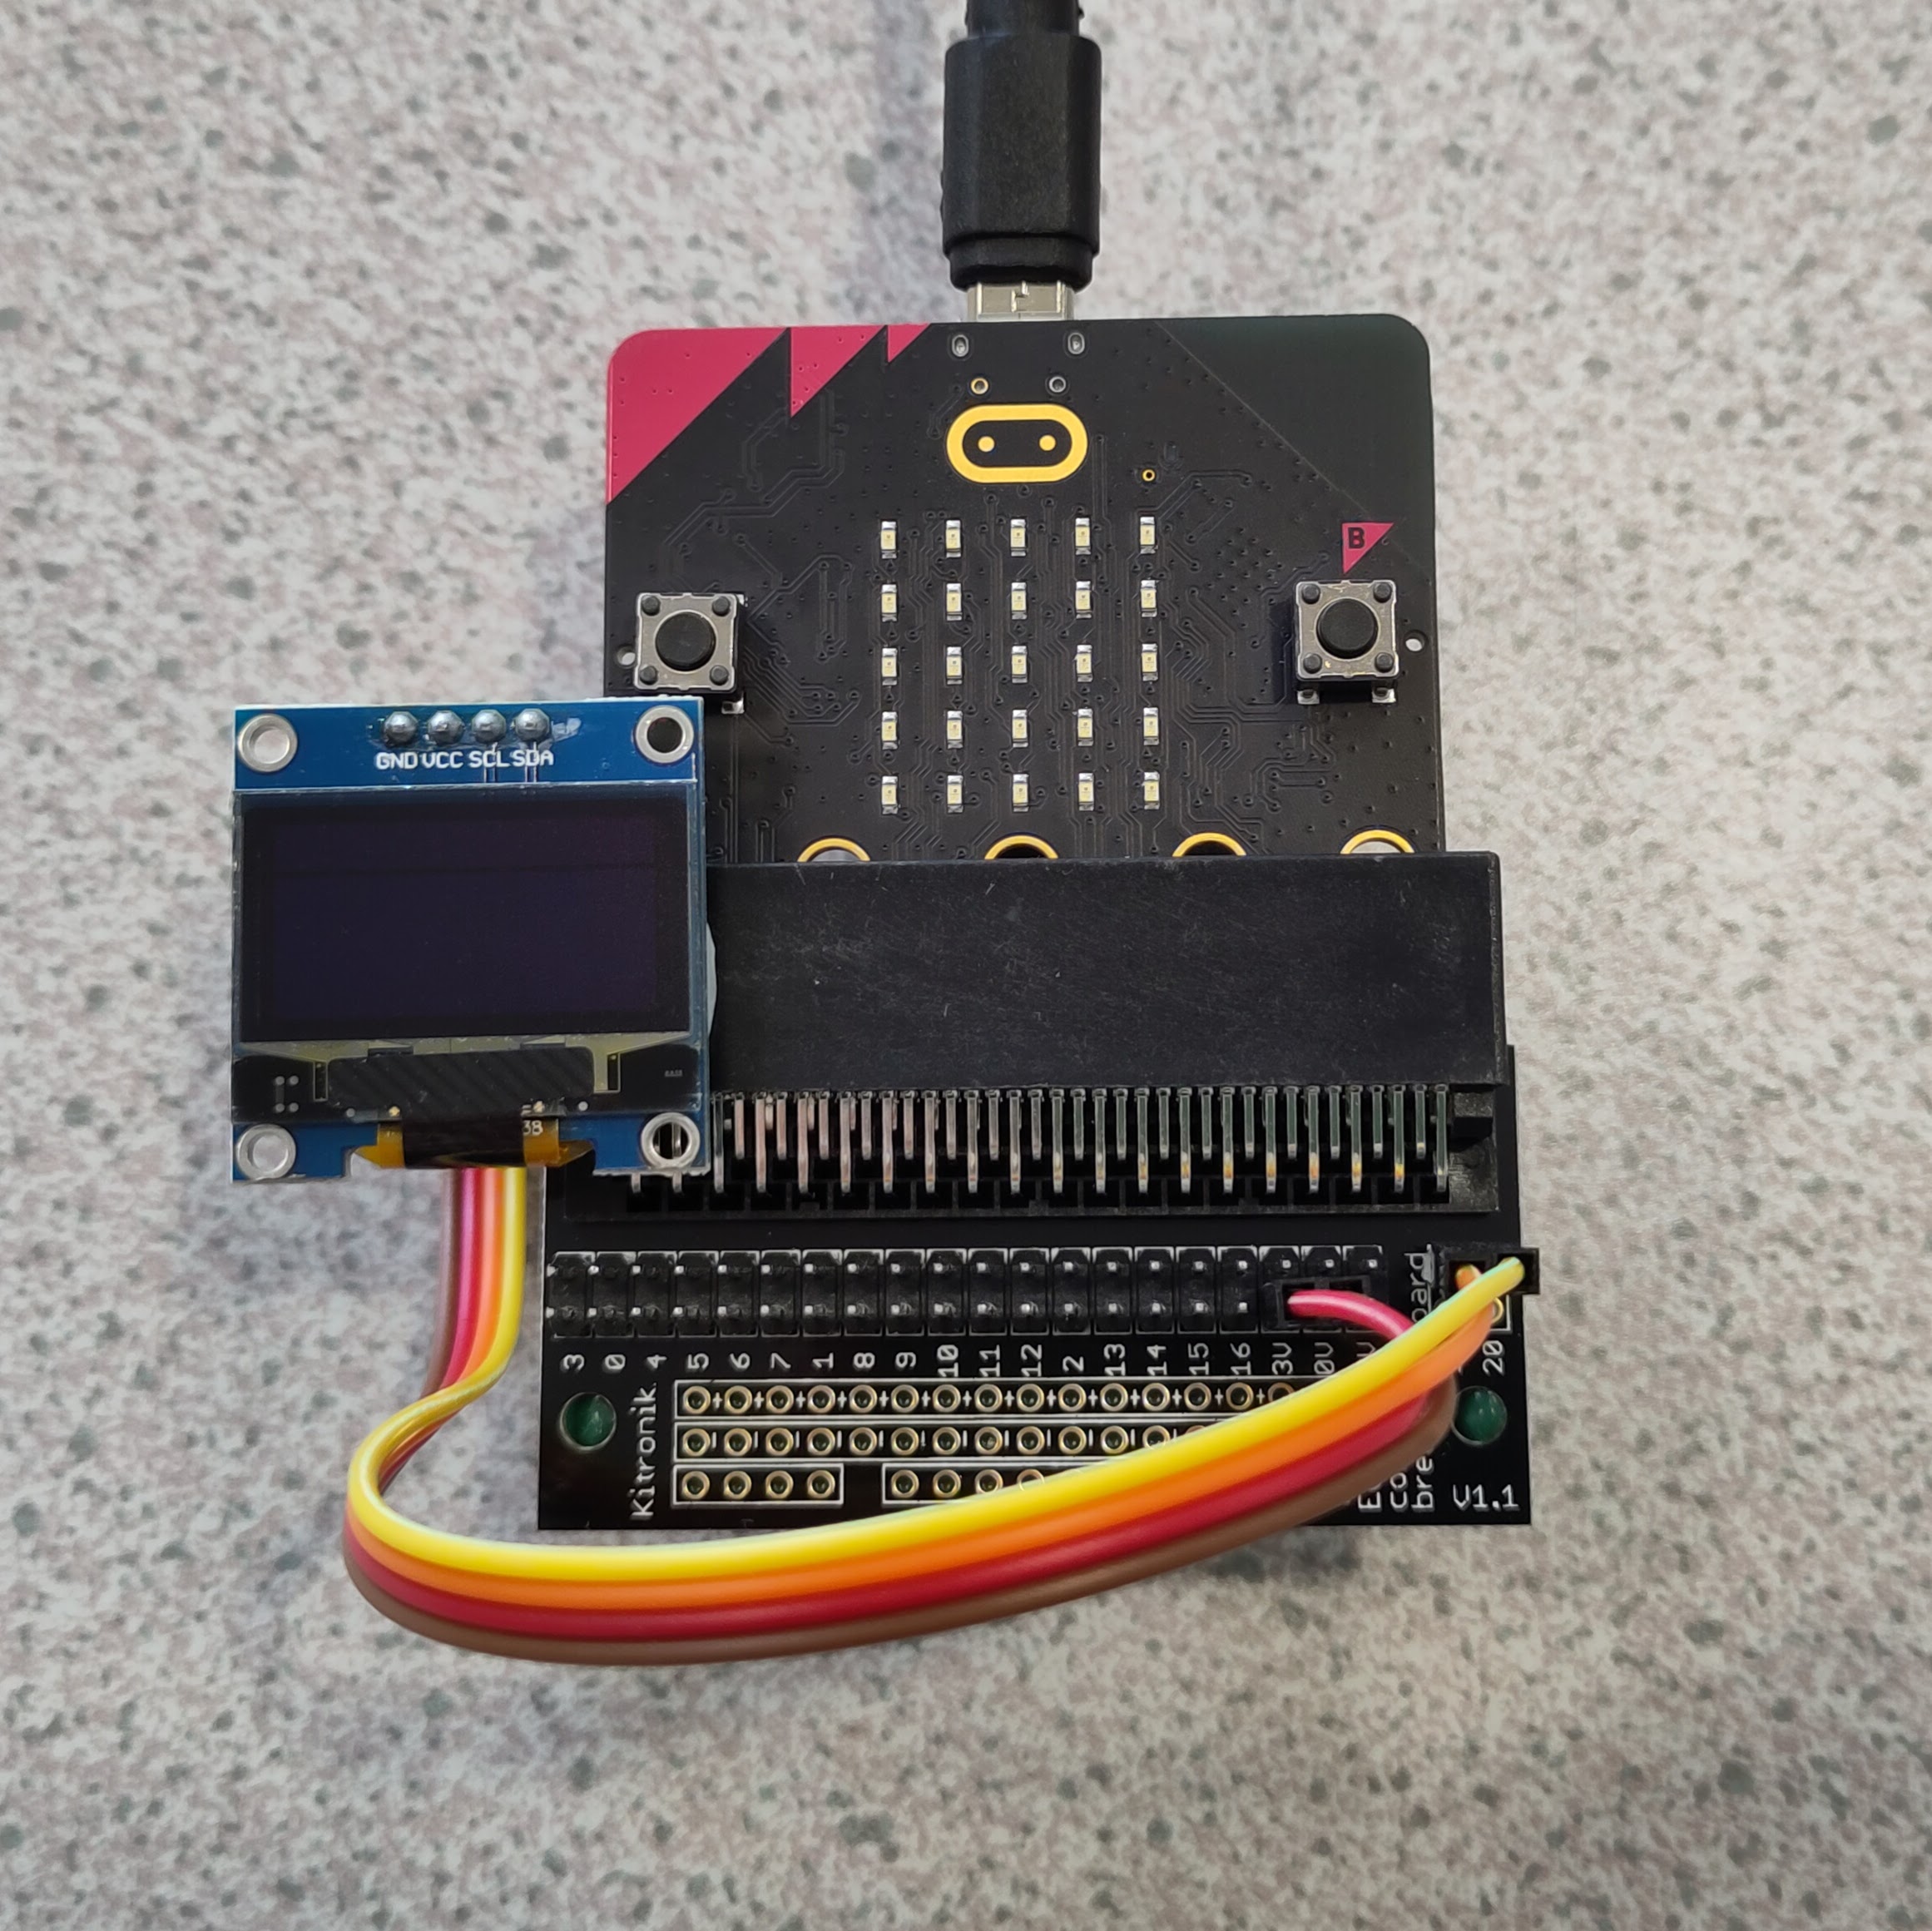
The OLED screen has a width of 128 pixels.
This means that we can put 128 points of data onto our graph.
To measure the sound level in the room 128 times, try this code:
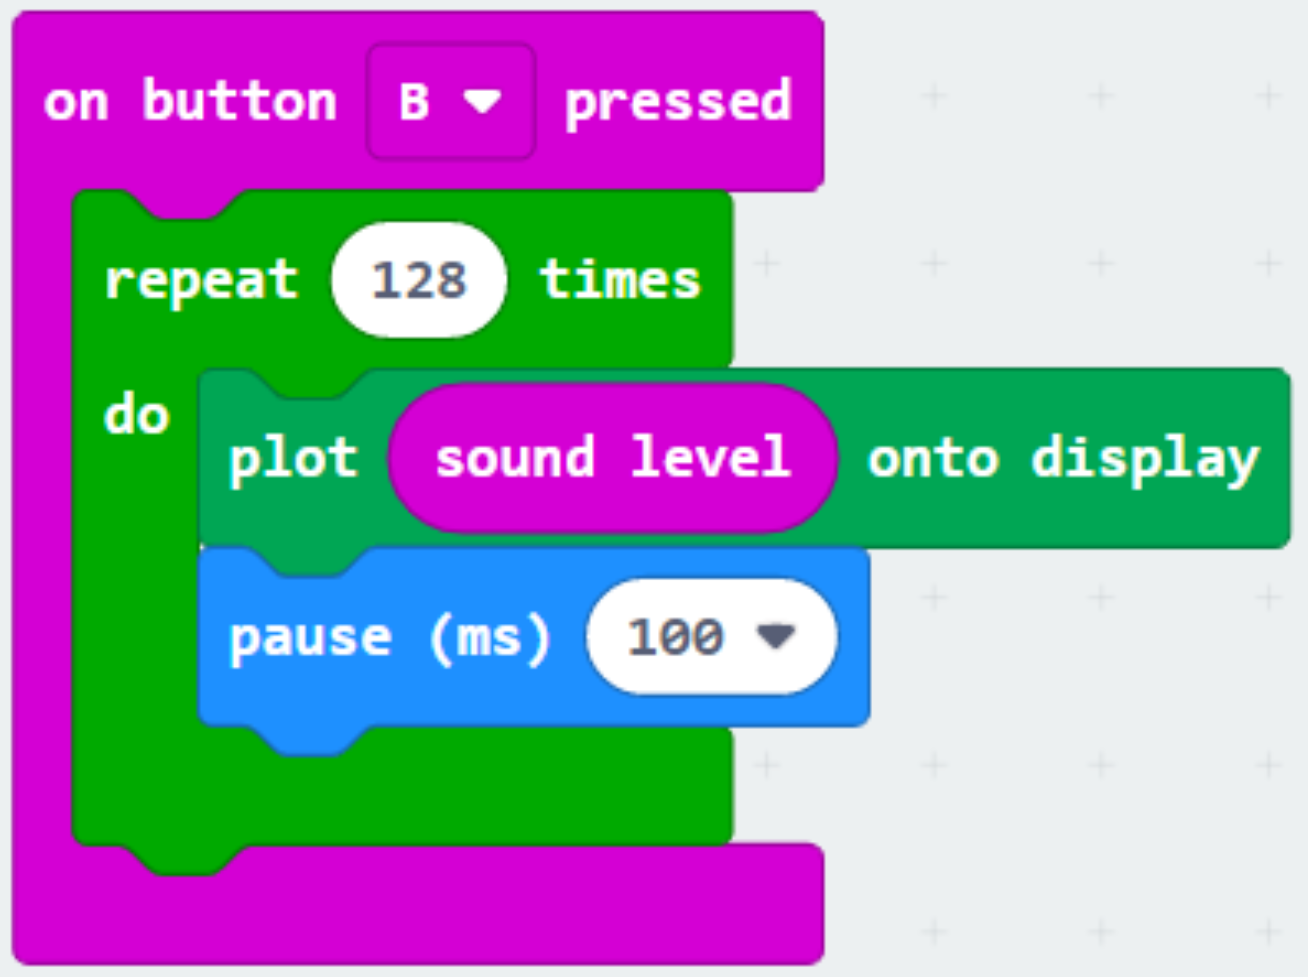
Test it out - do you get a graph on your OLED screen?
You can use MakeCode's Datalogger extension to save the information to the micro:bit, as well as showing it on the OLED screen.
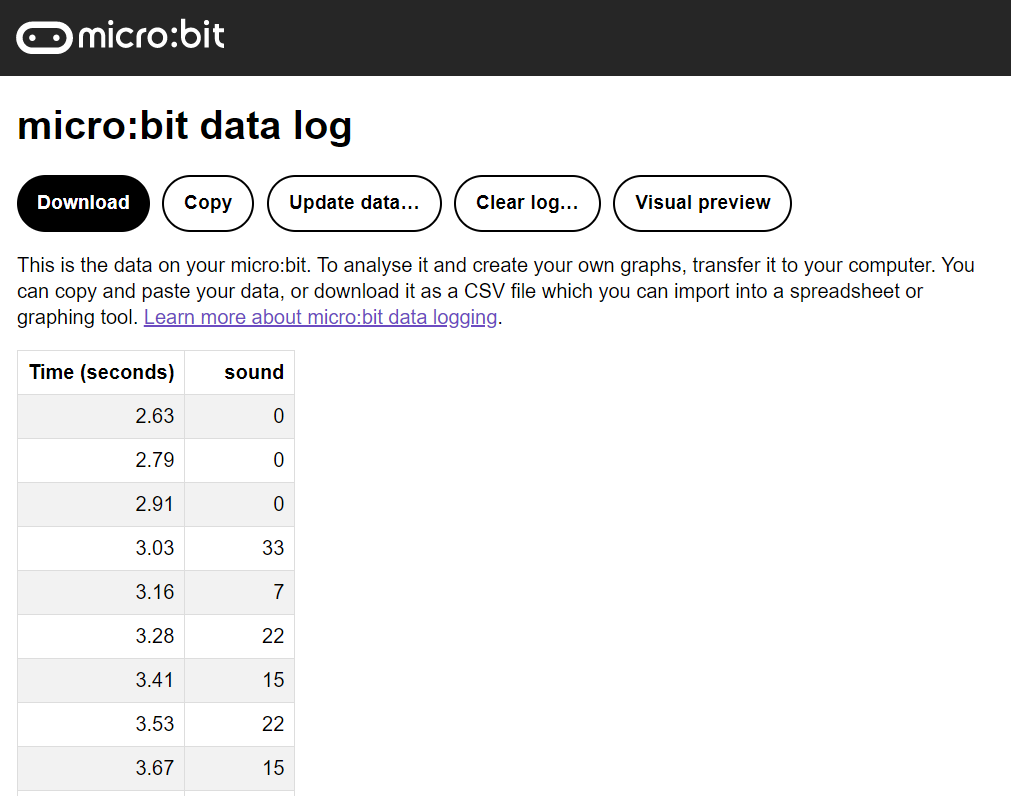
It can be tricky to get your data, so click here for step-by-step instructions, and follow them carefully.